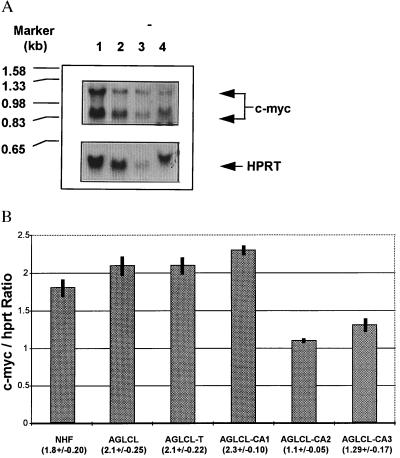
Figure 4.
(A) Northern blot analysis of levels of c-myc expression were compared between the parental nontransfected AGLCL cells and AGLCL-transfected cell-induced tumors. Lanes: 1, results of expression of the AGLCL-transfected induced tumors; 2 and 3, data on expression from cell lines derived from tumors induced by different transfected AGLCL cells; 4, data on parental AGLCL cells before transfection. Each lane contained 20 μg of total RNA. The arrows (Upper) indicate where the c-myc probe detected levels of expression in each of the cell lines and tumor. (Lower) HPRT probe was used as an internal control for expression in all the preparations. (B) Digital analysis of the semi-quantitative PCR results revealed that c-myc levels of expression, when normalized to internal hprt levels, yielded data that indicated that there was no increase in levels of c-myc expression. The values in parentheses are the mean values for three measurements ± SD. NHF, cells prepared from normal human neonatal foreskins; AGLCL, parental EBV immortalized LCL cells; AGLCL, designate transfected-induced AGLCL solid tumor-derived cell lines AGLCL-CA1, AGLCL-CA2, and AGLCL-CA3. The numerical values presented under the bar graphs represent 6 samples for 5 dilutions at 23 cycles for both c-myc and hprt in the Perkin–Elmer Cycler.

