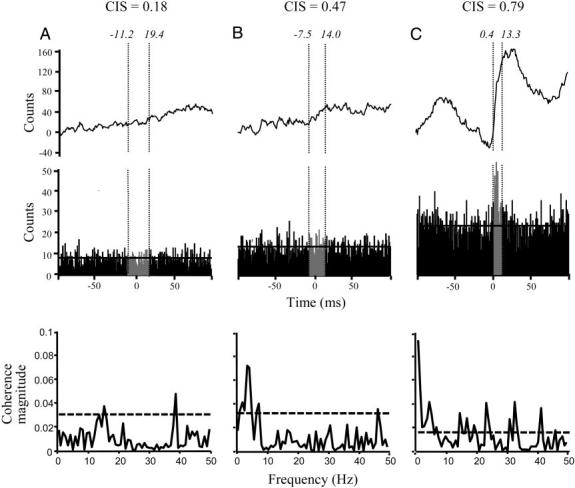
FIG. 3.

Comparison of time and frequency domain analysis. A--C, middle: the cross-correlograms computed on motor-unit pairs from FPL–FDP3, FPL–FDP2, and FDP4–FDP5 (subjects 5, 3, and 4, respectively). The CIS values are given as well as the peak start and end times (in italics). Top: the cumulative sum (cusum) of the counts in each cross-correlogram used to define the peak region. Vertical dotted lines delineate the peak duration. Bottom: the coherence between the same motor-unit pairs used to compute the cross-correlograms above. The values on the y axis are the magnitude of the motor-unit coherence across the frequency range of interest (x axis; bin width = 0.78 Hz). Horizontal dotted line indicates the 95% confidence limit above which the magnitude of the coherence is defined as statistically significant.
