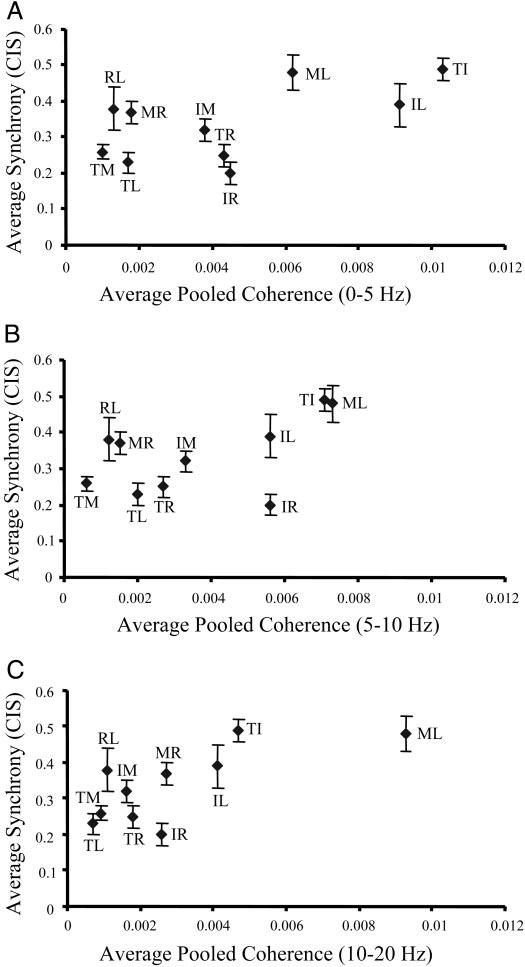
FIG. 7.

Strength of motor unit synchrony and coherence. Each data point represents the average motor unit synchrony (CIS; vertical axis) and pooled coherence averaged within 0–5 Hz (A), 5–10 Hz (B), and 10–20 Hz (C) frequency ranges (horizontal axis) for each of the 10 digit pair combinations. Vertical error bars indicate the SD of the mean CIS values. For graphical clarity, SD of the mean coherence was omitted. Digits labeled as in Fig. 6.
