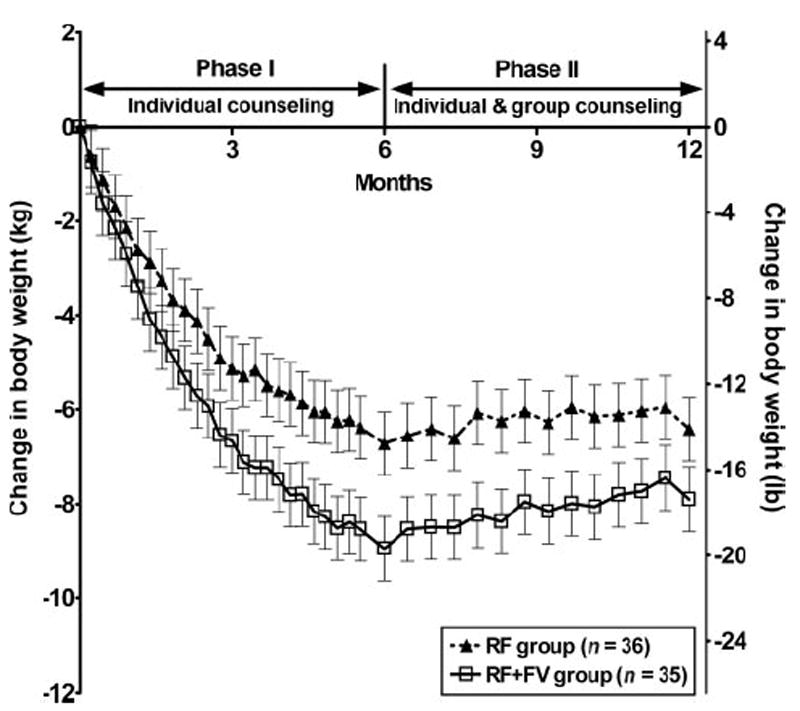
FIGURE 2.

Mean (± SEM) change in body weight for study completers in the reduced-fat (RF) and reduced-fat plus increased fruit and vegetable (RF+FV) intervention groups over time. Random coefficients analysis was used to model the longitudinal response over time, with control for baseline values. The group × time interaction (P = 0.002) indicates that the response over time differed between the groups. The interaction remained significant (P = 0.021) when all randomly assigned subjects were included in the analysis. Baseline values did not differ significantly between the groups (unpaired t test).
