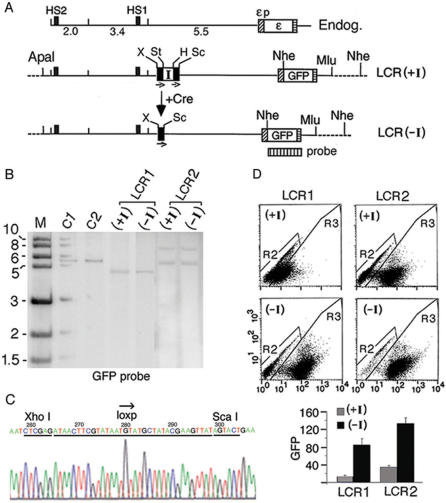
Figure 2.
The insulator inserted between the HS2 enhancer and the ε-globin promoter blocked HS2 enhancer function. (A) Maps of the K562 endogenous ε-globin gene locus and the integrated LCR(+I) and LCR(–I) plasmids. I: the chicken HS4 insulator; the insulator insertion site was located immediately 5′ of primer pair 11 (Figure 1A); bars with small arrows underneath: directional loxp sites; dotted lines: K562 genomic DNA flanking the integrated plasmids; X, St, H and Sc: Xho I and Stu I sites and Hind III and Sca I sites flanking respectively the 5′ and the 3′ loxp sites; +Cre: Cre-mediated in situ recombination. Note that after cre-mediated recombination between the two loxp sites in LCR(+I), Xho I and Sca I sites now flanked the single loxp site in the LCR(–I) plasmid. Vertically striped box: GFP probe for Southern blot. (B) Southern blot of the (+I) and (–I) clonal lines in LCR1 and LCR2 after Nhe I digestion. M: kilobase size markers; C1 & C2: copy number standards, one and two copies of a linearized HS2-1.2-εp-GFP plasmid. (C) DNA sequence of the PCR fragment amplified across the single loxp site in integrated LCR(–I) plasmid (Figure 3C). (D) FACS analysis of GFP expression. Top: dot-plots of GFP fluorescence. X-axis: the fluorescent intensities of the cells analyzed by FACS; Y-axis: side scatter. R2 & R3: gated non-fluorescent and fluorescent cells; each dot represented one cell. Bottom: GFP levels determined by the product of the percentage of fluorescent cells in 20 000 analyzed cells (R3%) multiplied by the mean fluorescent intensities of the gated fluorescent cells (Xmean) as described (21). The R3% and the Xmean of R3 cells calculated by the Cellquest software for LCR1(+I) were (43%, 25); LCR1(−I), (80%, 108); for LCR2(+I) (60%, 55) and LCR2(−I) (90%, 147).

