Figure 6.
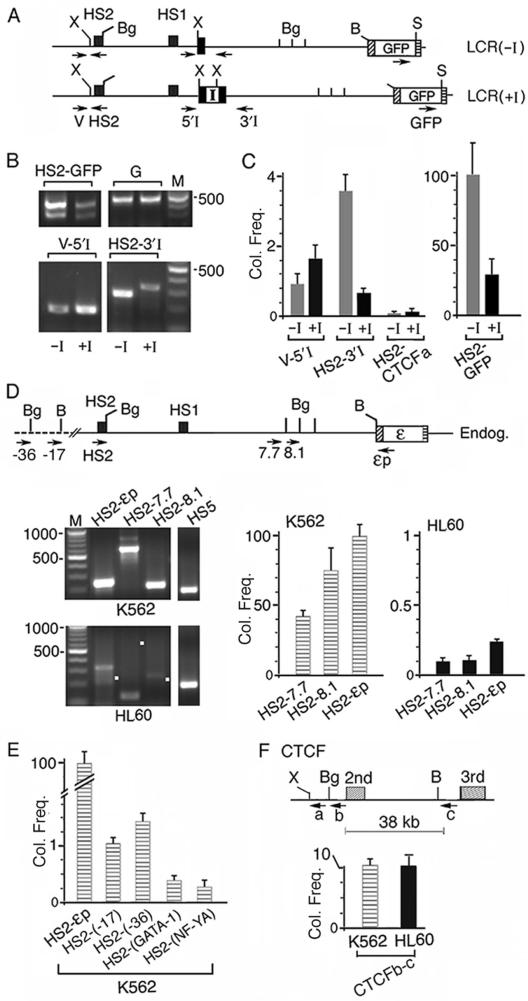
The interposed insulator caused the HS2 enhancer DNA to co-localize at a high frequency with the insulator site and at low frequencies with the intervening DNA and the ε-globin promoter. (A) Maps of enzyme sites used in 3C digestions: Xho I (X) and Sal I (S) sites unique to the plasmids and BamHI and Bgl II sites present in both the plasmid and the endogenous K562 DNA. Arrows: locations of 3C primers; direction of arrows: 5′→3′ direction of the primers; primer V was located in the vector sequence of the integrated plasmids. (B) HS2-GFP, V-5′I and HS2 3′I panels: 3C bands generated respectively by the HS2 enhancer with the GFP gene, the intervening DNA near the 5′ and 3′ ends of the single loxp site or the insulator; −I and +I lanes: 3C bands generated from LCR2(−I) and (+I) lines. HS2-GFP bands were generated by 37 PCR cycles and V-5′I and HS2 3′I bands by 43 PCR cycles. Panel G: the GFP gene amplified by primer pair 3 (Figure 3A). (C) Average co-localization frequencies calculated from quantified intensities of the 3C bands, after normalization with respect to the different amplification efficiencies of each of the three 3C primer pairs (Figure S3). Y-axis: normalized co-localization frequency (Col. Freq) generated by the different primer pairs shown on the x-axis. The intensity of the HS2-GFP band generated from LCR(−I) line was set at 100 and served as standard for comparison. HS2-CTCFa lanes: the co-localization frequencies between HS2 in LCR(−I) or (+I) and the CTCF gene (Figure 6F). (D) 3C products generated by the endogenous ε-globin gene locus in K562 and HL60 cells. Top: map of Bgl II (Bg) and BamHI (B) sites used in 3C digestions. Bottom left: HS2-7.7, HS2-8.1 and HS2-εp co-localization products generated by the respective 3C primer pairs. White dots mark the sizes of the anticipated 3C bands. The 3C bands from K562 cells were generated by 37 PCR cycles and those from HL60 cells by 43 PCR cycles. Bottom right: Co-localization frequencies (Col. Freq) as measured by the relative abundance of the 3C products amplified by the different primer pairs in real-time PCR. Abundance of the 3C product generated by primer pair HS2-εp in K562 cells was set at 100 and served as standard for comparison, since the PCR cycle number at the crossing-over point (Scop) amplified with this primer pair was the lowest among the 3C products amplified by the different primer pairs, indicating that the 3C product amplified by the HS2-εp primer pair was the most abundant. The abundance of the 3C products amplified by the other primer pairs, i.e. Col. Freq., was then calculated from the difference between the Tcop of the specific test primer pair and the reference Scop according to the formula Col. Freq. = 100/2Tcop–Scop. (E) Co-localization frequencies of the HS2 enhancer with regions outside of the globin gene locus. HS2-(-17) and HS2-(-36): Col. Freq. of HS2 with the DNAs located at 17 and 36 kb upstream of the HS2 site (Figure 1A); HS2-(GATA-1) and HS2-(NF-YA): Col. Freq. of HS2 with the GATA-1 and the NF-YA genes. (F) Co-localization frequencies between the intronic regions of the CTCF gene in K562 and HL60 cells. a: CTCF primer near a Xho I (X) site used in 3C amplification with HS2 in Figure 6C; b and c: primers near a Bgl II (Bg) and BamHI (B) sites used in CTCFb-c amplification in Figure 6F. The co-localization frequence of HS2-εp set at 100 served as the reference.

