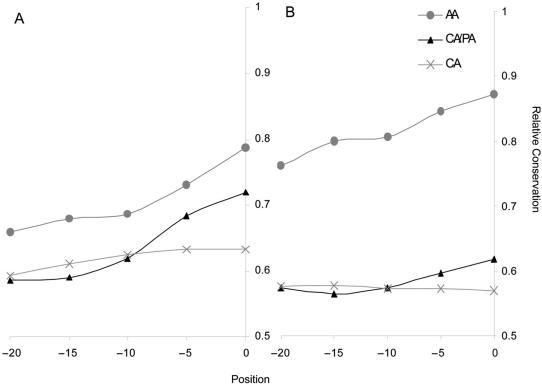
Figure 1.
Human–mouse evolutionary conservation shown for the CLOSE (A) and FAR (B) groups. Conservation was calculated for the 30 nt upstream of the proximal (or pseudo) splice site in overlapping windows of length 10. Gray circles account for alternative acceptor (AA) pairs, black triangles for constitutive/pseudo acceptor (CA/PA) pairs and the gray crosses for a set of 1000 randomly selected constitutive acceptors (CA). For the CA set, the conservation was calculated upstream of the constitutive splice site.

