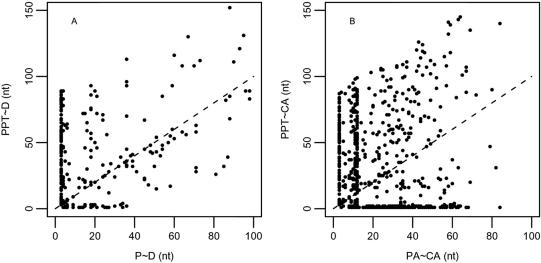
Figure 2.
PPT distribution. (A) The distance between the most downstream nt of the PPT and position −1 (or N site) at the distal NAG site is plotted against the number of nts between position −1 of the proximal and the distal splice site. (B) A control set in which the PPT-to-constitutive splice sites distance is plotted against the constitutive-to-pseudo splice site distance. The diagonal indicate positions for which the PPT is adjacent to the proximal (or pseudo) splice site.

