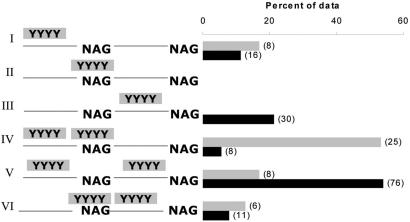
Figure 3.
Position of PPTs relative to the proximal splice site in the FAR group. The bars indicate the percent of observations in the data. I–III are cases in which only one PPT was found upstream (I), overlapping (II) or downstream (II) the proximal splice site. IV–VI are cases in which two PPTs were observed (IV) flanking the proximal site, (V) one PPT overlapping the splice site and the second one upstream and (VI) one PPT overlapping the splice site and the second one downstream of the proximal splice site. The gray bars represent alternative acceptor pairs and the black bars represent constitutive/pseudo acceptor pairs in which the pseudo splice site mimics the proximal site. The number of occurrences is shown in brackets.

