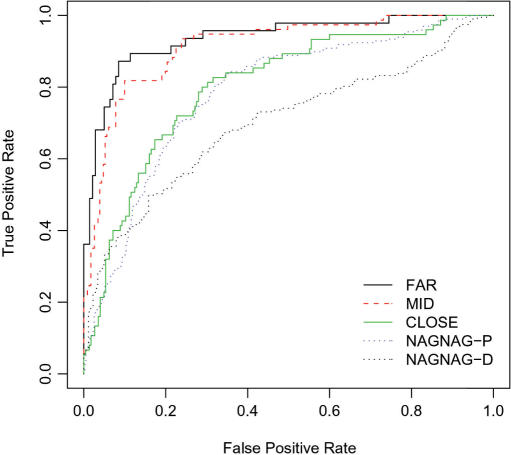
Figure 4.
ROC plot summarizing the SVM results: False positive rate is plotted against the true positive rate for alternative acceptors versus constitutive/pseudo acceptor pairs in the FAR (black line), MID (red dashed), CLOSE (green line), NAGNAG-proximal (blue dots) and NAGNAG-distal (black dots) groups.

