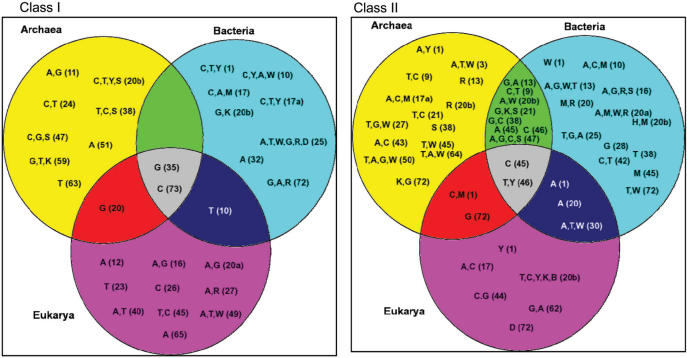
Figure 5.
Distribution of Class I and Class II discriminating trends within the three domains of life. Discriminating class-specific trends highlighted in Figure 4 are shown here as a Venn diagram, a type of illustration frequently used in discrete mathematics to illustrate all possible logical relationships of sets of elements. Here the Venn diagram is applied to better illustrate how class-specific trends are shared by the three domains of life, Bacteria, Archaea and Eukarya. Class I and Class II-specific trends are presented in the left and right panels, respectively. The universal conventional tRNA numbering of the Sprinzl database is used (64). The letters indicate class-specific discriminatory elements, strictly absent class-specific elements that exclude at least one sequence from the opposite class, as explained in the legend of Figure 1. The overlapping areas contain elements that are characteristic to 2 (three such areas) or 3 (one such area) kingdoms. For instance, at the Class I panel the G (20) in the overlapping area of the Archaea/Eukarya circles means that for the majority of the species G is strictly absent at position 20 in both of these kingdoms, and the absence of G at this position excludes at least one Class II sequence from Class I (at least one Class II sequence contains a G here, therefore cannot belong to Class I). Similarly, at the Class II panel in the central area T, Y (46) means that for the majority of the species in all three kingdoms either a T, or a T and a C (Y) are strictly absent, and this absence excludes at least one sequence from the opposite class.

