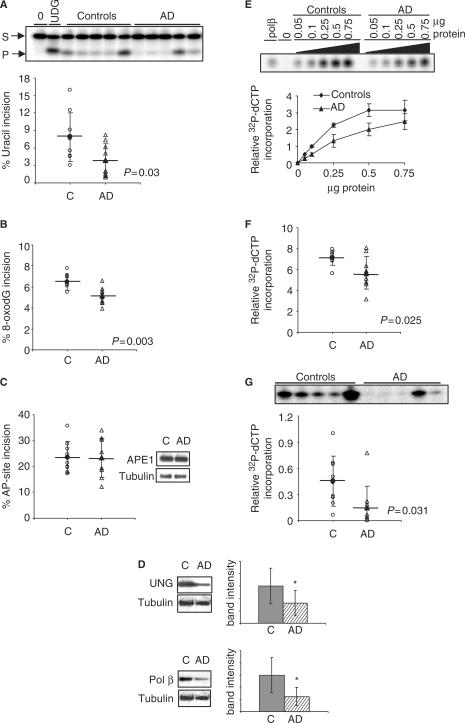
Figure 3.
BER activities and protein levels are lower in cerebellum samples from human AD than in control subjects. (A) Uracil (B) 8-oxodG and (C) AP-site incision activities in cerebellum lysates of AD and aged-matched control samples. Incision activities were calculated from the amount of radioactivity in the products relative to the total in the lane. (C) Also contains typical western blot analyses of APE1 in AD and control cerebellum samples. (D) Western blot analyses of UNG and Pol β in AD and control IPL samples. Typical blot image and quantification of all samples is shown. Bar graphs represent average ± SD. * denotes P < 0.05 (E) single nucleotide gap-filling activity as a function of protein concentration in five AD and five control samples. (F) Single nucleotide gap-filling activity of all AD and control samples. (G) Gel image of uracil-initiated BER of five AD and control samples, and uracil-initiated BER values of all AD and control samples. Mean values are marked by a horizontal line and error bars represent SD.

