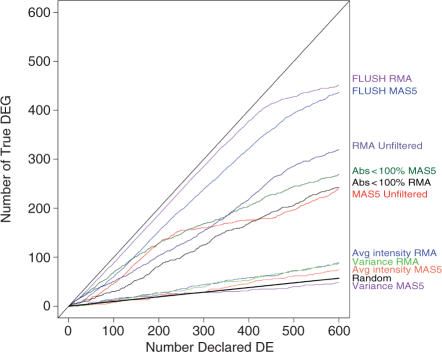
Figure 4.
Cumulative distribution of true DE genes versus number of genes declared DE for the various filtering procedures. Criteria for the presence call, average intensity and variance filtering were chosen in order to retain a number of features comparable to the FLUSH method (5 610 genes). Presence-call filtering retained features with at least one presence or marginal call among the six samples (Abs < 100%, 4 899 genes). Both average intensity and variance methods filtered out 60% of genes (5 604 genes kept). The straight line labeled as ‘Random’ represents the expected number of DE identified through a random selection of genes. R is defined as the number of genes declared significant, the number of TDE may be computed as (1−π0)*R, where π0 represents the proportion of non-DE genes. In the Golden Spike data π0 = 90.5%.

