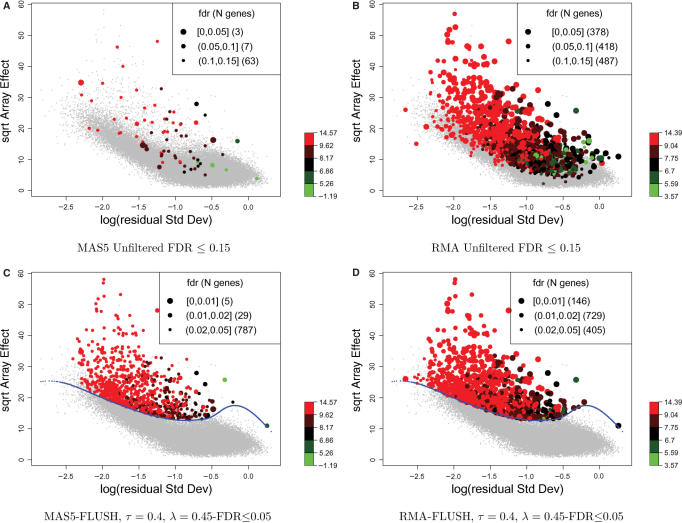
Figure 5.
Filtering of probe sets from a mouse model of retinal degeneration. (A) and (B) show RA-plots for both MAS5 and RMA unfiltered probe sets. Features with fdr < 0.15 have point size related to fdr values with larger dots having smaller fdr. (C) and (D) show the corresponding plots for filtered probe sets. Quantile-regression smoothing was fitted with τ = 0.4 and λ = 0.45. Features with fdr < 0.05 have point size related to fdr values with larger dots having smaller fdr. In all plots, points are colored according to the average intensity computed either on MAS5 or RMA expression values (on logarithmic scale).

