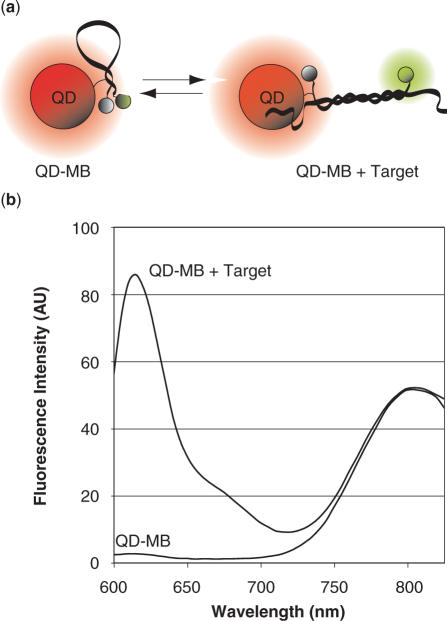
Figure 2.
Schematic and emission spectrum of QD–MB conjugates. (a) Schematic of MB-QD conjugates in the presence and absence of target RNA. (b) The emission spectrum for 10 nM QMBs (Cal610 reporter, Iowa Black RQ quencher, and a QD800 quantum dot) was recorded in the absence and presence of excess complementary oligonucleotide targets. The addition of complementary target led to a large increase in MB fluorescence; however, the QD fluorescence remained unchanged. This labeling ratio (prior to purification) was 6 MBs per QD for the QD–MB emission spectrum shown.

