Figure 3.
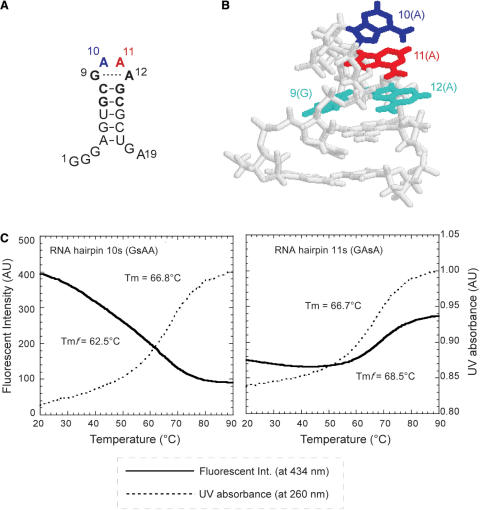
Incorporation of the fluorescent s base into GNRA hairpins. (A) The secondary structure of the RNA hairpin with a GAAA loop. The second A and third A in the loop are shown in blue and red, respectively. (B) The 3D structure of the GAAA-loop hairpin (35). (C) The profiles of the fluorescent intensity at 434 nm (solid lines) and the UV absorption at 260 nm (dotted lines) of the RNA hairpin with a GsAA (RNA hairpin 10s) or GAsA (RNA hairpin 11s) loop. Tm and Tmf values were obtained from the UV melting and fluorescent intensity profiles, respectively.

