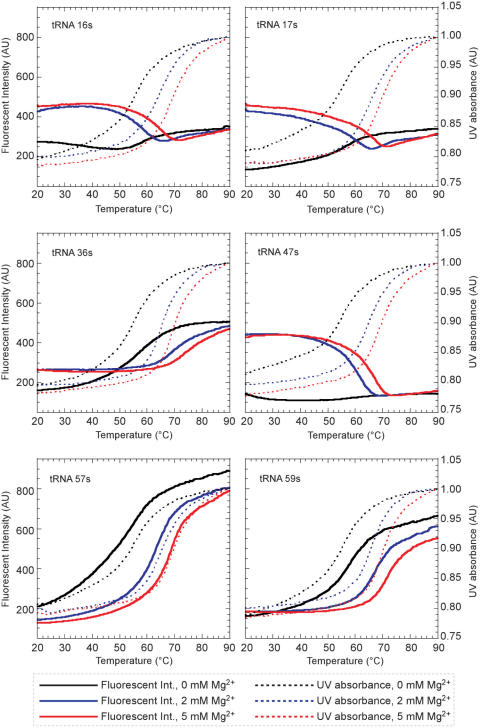
Figure 5.
The fluorescent intensity and UV absorption profiles of tRNA molecules containing s at specific positions. Melting curves obtained by the changes in the fluorescent intensities at 434 nm (solid lines) and in the UV absorbance at 260 nm (dotted lines) of the tRNAs containing s at various positions.

