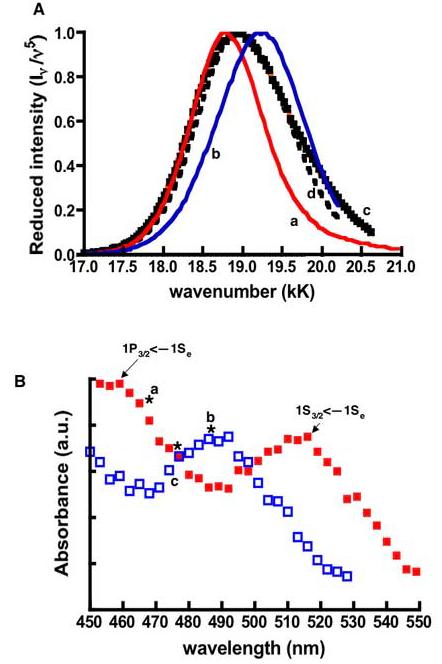
Figure 3.

A. Normalized reduced spectra from excitations at (a) 470EX (b) 490EX (c) 480EX. (d) Mathematical averaged spectrum of 470EX and 490EX spectra. B. Generally, the band edge transitions of larger dots are characteristically lower in energy than their smaller counterparts (8). Model absorption spectra of larger-sized (bold squares) and smaller-sized dots (open squares) are shown here to display the spectral mismatch of the absorption bands, which correspond to their respective lowest electronic transitions. Resonance excitation at the wavelengths marked by asterisks yielded the (a) red shifted, (b) blue shifted, and (d) broad spectra shown in panel A.
