
Fig. 1.
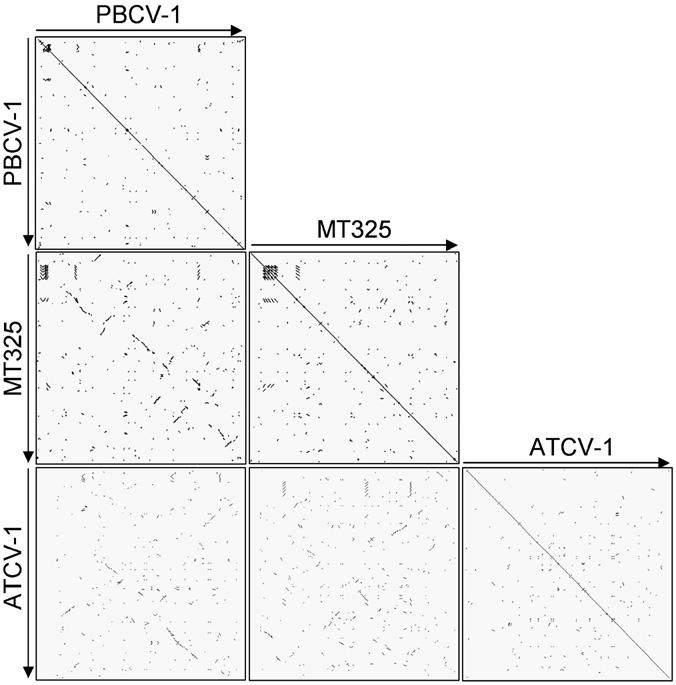
Comparison of three sequenced chlorella virus (PBCV-1, MT325, and ATCV-1) major ORFs with blastp dot plots. The dots represent ORF homology between two viruses with an E-value of less than 0.001.
Official websites use .gov
A
.gov website belongs to an official
government organization in the United States.
Secure .gov websites use HTTPS
A lock (
) or https:// means you've safely
connected to the .gov website. Share sensitive
information only on official, secure websites.
Comparison of three sequenced chlorella virus (PBCV-1, MT325, and ATCV-1) major ORFs with blastp dot plots. The dots represent ORF homology between two viruses with an E-value of less than 0.001.