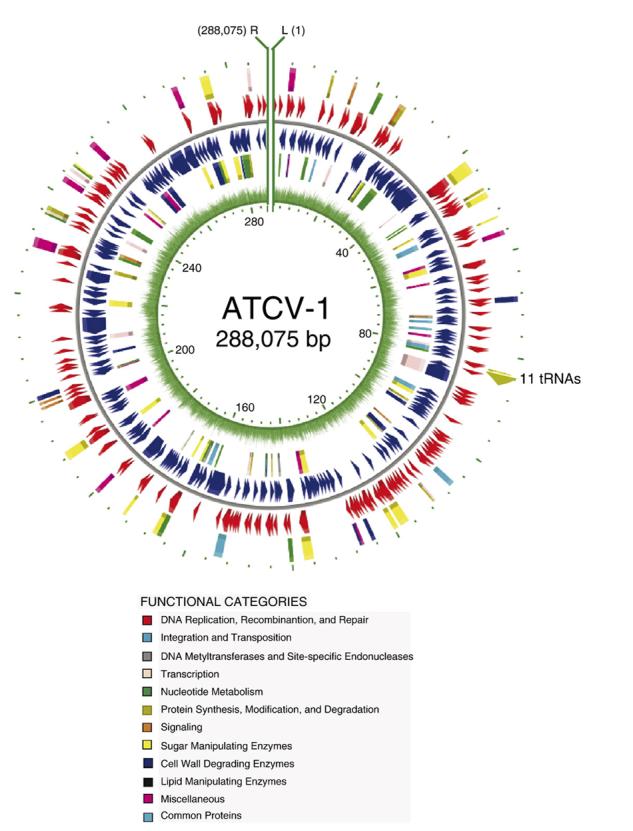
Fig. 3.

Map of the ATCV-1 genome arranged in a circle. However, the genome is a linear molecule and the ends are depicted at the top of the figure as green lines (L and R represent the left and right ends of the genome, respectively). The predicted ORFs are shown in both orientations and colored according to their functional category. The inner green circle represents the percent A + T across the genome using a 25 bp window.
