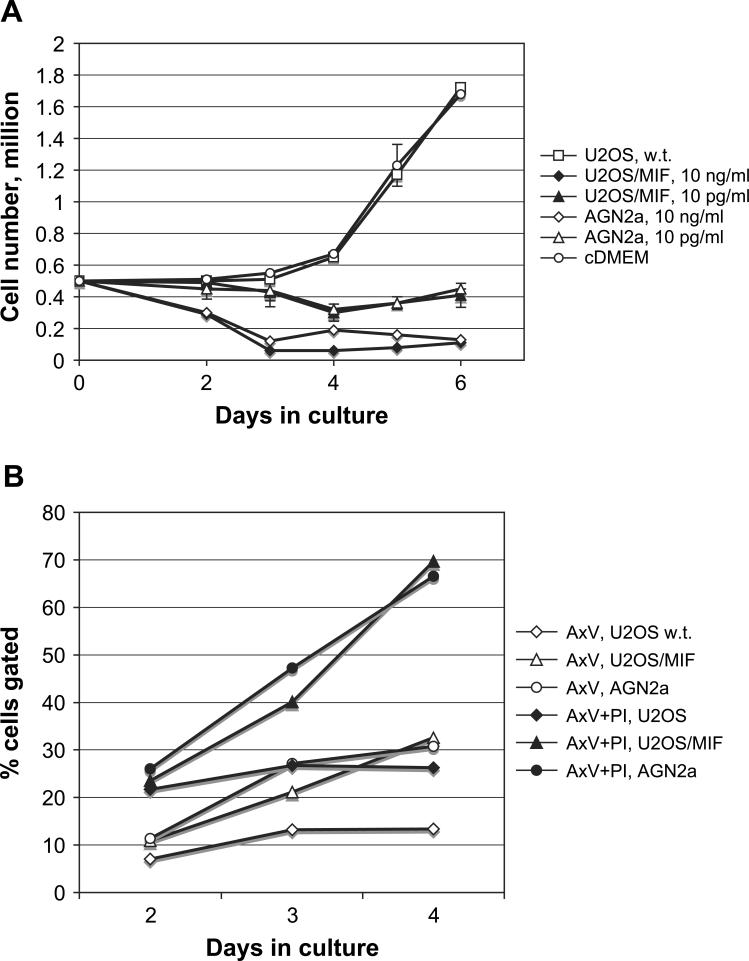
Fig. 5.
MIF inhibits the numeric expansion of cytokine activated T cells. (A) B6 T cells were cultured with IL-2 and IL-15 in the absence of culture supernatants (cDMEM, open circle), in the presence of U2OS/MIF supernatant diluted to 10 ng/ml or 10 pg/ml MIF as determined by ELISA (closed diamond and closed triangle, respectively), AGN2a supernatant diluted to 10 ng/ml or 10 pg/ml (open diamond and open triangle, respectively) or with wild-type U2OS supernatant at the same dilution as the U2OS/MIF supernatant (open square). Data shows total viable cells in culture as determined by vital dye exclusion. Values plotted are the average of triplicate wells, and standard deviations greater than 10% are shown. 10 ng/ml MIF from either source differed significantly from U2OS control on day 2 (P < 0.01), and at 10 ng/ml on day 4 (P < 0.01). (B) Cultured T cells were analyzed by flow cytometery upon exposure to culture supernatants. Open symbols show the percentage of cells at the indicated time points that stained positive with annexin V and the closed symbols show the percentage of cells that gated positive for both annexin V and propidium iodide (PI) staining. Cells were treated with 10 ng/ml MIF from AGN2a culture supernatant (circles), U2OS/MIF culture supernatant (triangles), or media alone (diamonds).

