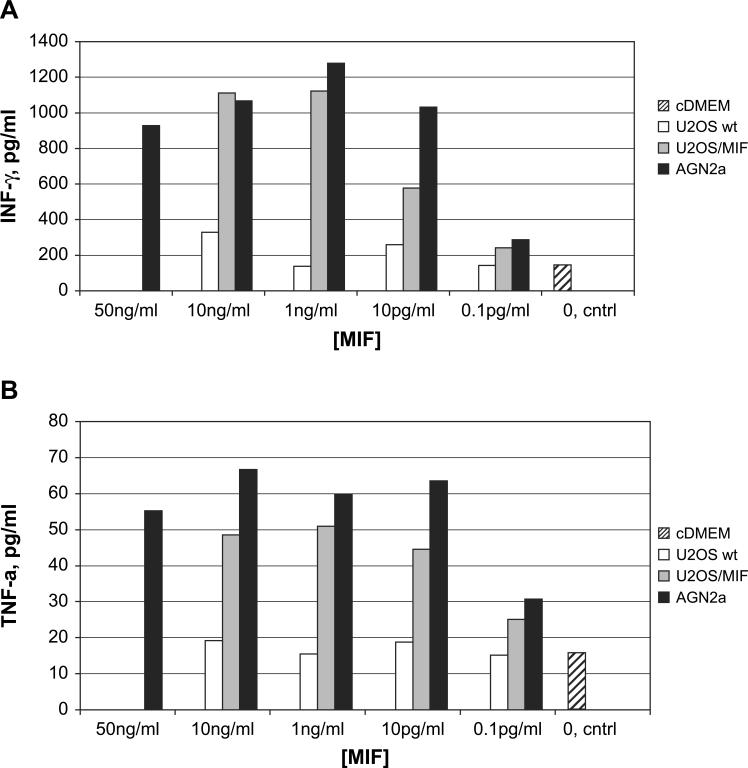
Fig. 6.
Analysis of cytokines produced by MIF-treated T cells. B6 T cells were cultured in the presence of IL-2 and IL-15 alone (striped) or with control U2OS (open), U2OS/MIF (gray), or AGN2a (black) culture supernatants normalized to the indicated MIF concentrations by ELISA. After 72 h of T-cell culture, IFN-γ (panel A) and TNF-α (panel B) levels in the culture supernatants were determined using a flow cytometric bead array. A representative experiment of more than three independent experiments is shown.

