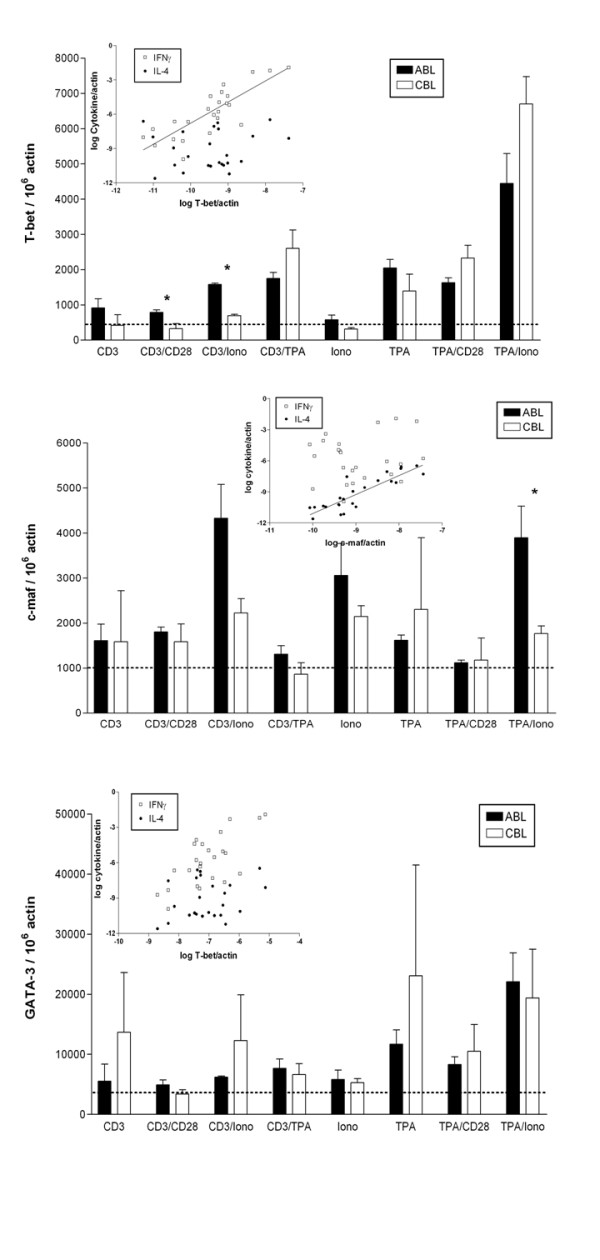
Figure 6.

Induction of transcription factors in ABL and CBL after stimulation for 4 hrs. mRNA levels of T-bet (A), GATA-3 (B), and c-maf (C) were determined using real-time RT-PCR. Data are expressed as arbitrary units normalized to β-actin to correct for RNA quantity and integrity. Columns are the mean ± standard for 3 donors. The inset shows the correlation between expression of the respective transcription factor with IFNγ and IL-4. Dotted line indicates basal transcript levels. Iono – Ionomycin.
