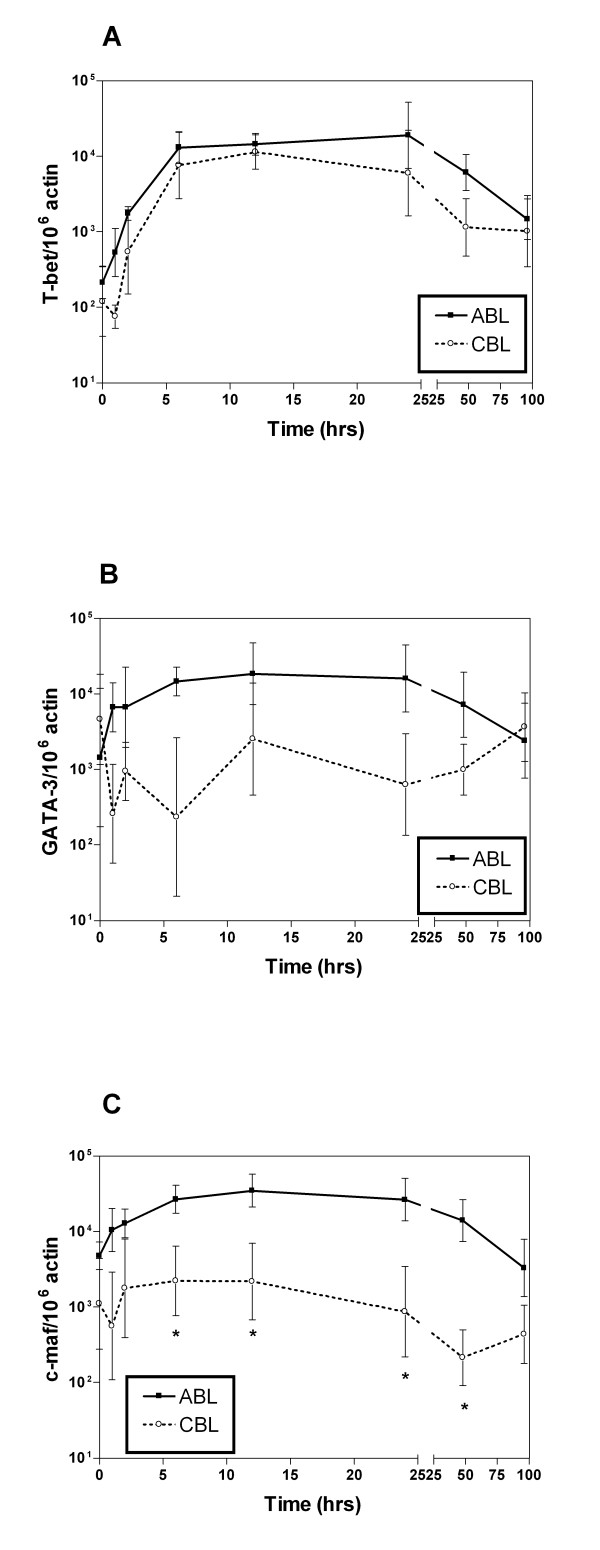
Figure 7.
Time course of transcription factor induction after stimulation with TPA and ionomycin. ABL and CBL were harvested at different time points by lysing cells. mRNA levels were determined for T-bet (A), GATA-3 (B), and c-maf (C). Data points are mean ± standard error for 6 donors. *p < 0.05 ABL vs. CBL.

