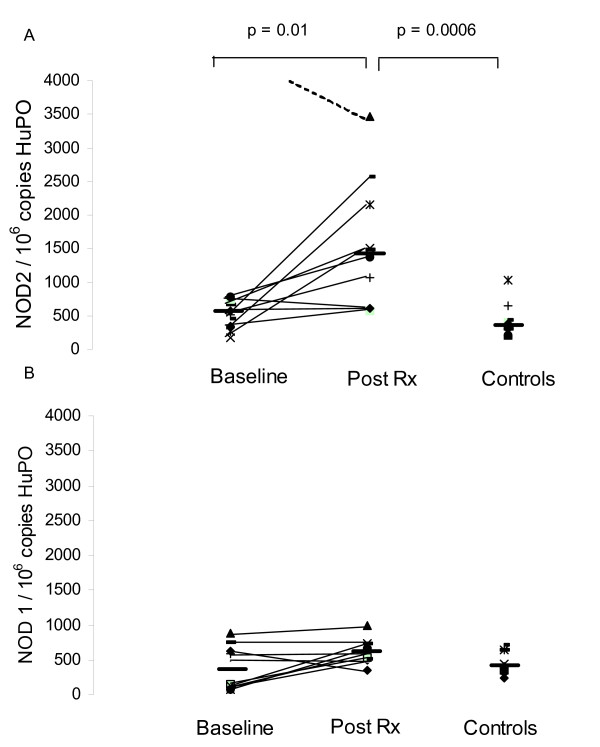
Figure 4.
NOD1 and NOD2 mRNA expression in peripheral blood cells obtained from patients with tuberculosis, before and after anti-tuberculous treatment. NOD1 and NOD2 mRNA expression was analysed, by real-time RT-PCR, in peripheral blood cells isolated from patients with tuberculosis and matched controls. To permit comparison between individuals, absolute copy numbers of NOD2 (4A) and NOD1 (4B) mRNA were measured during RT-PCR, using cDNA standards, and expressed relative to 106 mRNA copies of a validated housekeeping gene HuPO. NOD2 but not NOD1 mRNA levels increased significantly after treatment.

