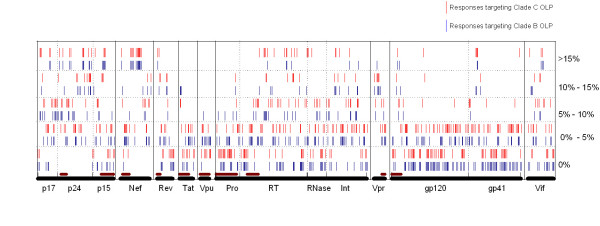
Figure 2.
The immunodominance and cross-reactivity analysis. The location of immunodominant and subdominant epitopes in the HIV-1 proteome. Five classes of recognition frequency are represented in the figure, (i) recognition frequency more than 15%, (ii) more than 10% but less than 15%, (iii) more than 5% but less than 10%, (iv) more than 0% but less than 5% and (v) not recognized in the study population. Inserted clade B fragments in the CRF07_BC genome are indicated as red bars adjacent to X-axis.

