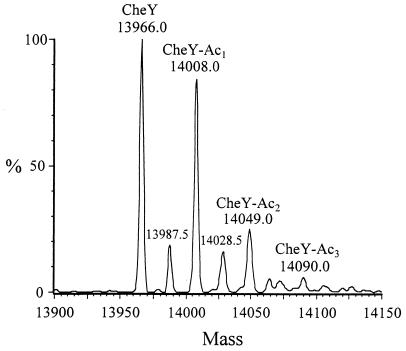
Figure 2.
Mass spectrometry reveals the presence of CheY with zero, one, two, or possibly three acetyl groups following incubation of CheY with Acs, acetate, ATP, and pyrophosphatase as described under Experimental Procedures. The peaks at 13987.5 and 14028.5 are the Na+ adducts of CheY and CheY-Ac, respectively.

