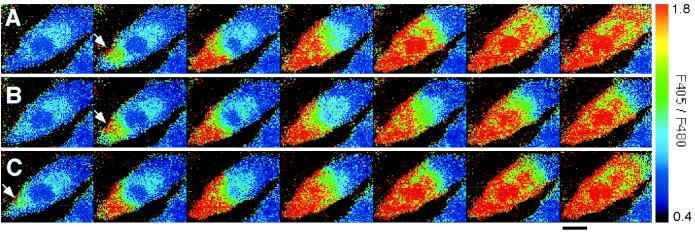
Figure 1.
Spatiotemporal organization of Ca2+ waves in response to repeated ATP stimulation. Each set of successive pseudocolored images represents a Ca2+ wave induced by sequential stimulation with 500 nM ATP under flow conditions three times in the same cell (A–C). Ca2+ waves repeatedly originated in the same locus at the cell edge (arrows).The images were made at intervals of 0.38 s. Flow direction is from left to right. (Bar = 20 μm.)

