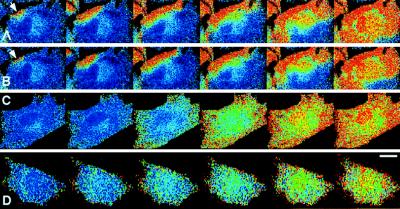
Figure 3.
[Ca2+]i changes in response to various agonists. Successive images demonstrate [Ca2+]i changes in response to (A) 500 nM ATP, (B) 100 nM bradykinin, (C) 1 μM A23187, and (D) 1 μM thapsigargin. The images are shown at intervals of 1.14 s in A and B, 2 s in C, and 18 s in D. The cell shown in A and B is the same and arrows indicate the specific locus for the Ca2+ wave initiation. Flow direction is from right to left in all images. (Bar = 20 μm.)

