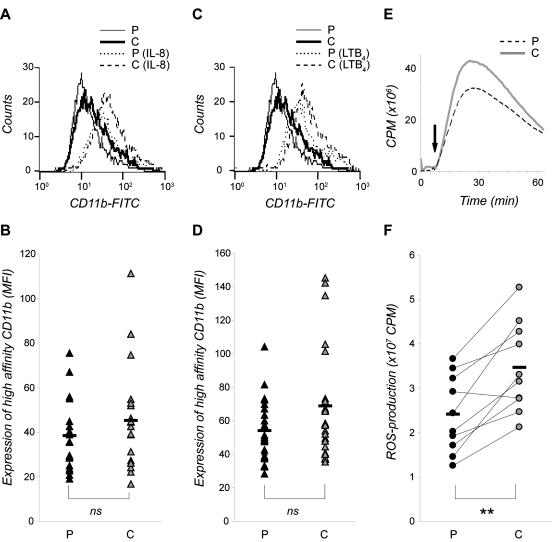
Figure 3. IL-8 and LTB4-induced expression of high-affinity state CD11b on neutrophils from patients with stable CAD.
(A–D) Whole blood from patients (P) and individually matched control persons (C) were incubated for 1 min with CBRM1/5 at 37°C, before stimulated for 10 min with (A–B) IL-8 (10 ng/mL) or (C–D) LTB4 (100 nM) at 37°C. The stimulation was stopped by incubating the samples on ice, and contaminating erythrocytes were removed by lysis. Antibody recognizing integrins displaying the high-affinity epitope was detected by FACS analysis. The cells were gated to identify the neutrophil population, and 10 000 cells were counted in each sample. Data are shown as one representative histogram plot (A,C) or as median of the mean fluorescence intensity (MFI) values (B,D) from 20 (A–B) and 25 (C–D) experiments per cohort done in triplicate. (E–F) Isolated neutrophils from patients and control persons were stimulated with C3bi-opsonized yeast particles (5×10⁶/mL), and the production of ROS was measured continuously for 60 min at 37°C. Data are expressed as counts per min (cpm) and shown as one representative histogram plot (E) or as total ROS production peak value from 10 experiments per cohort (F). Mean value is indicated as a black hyphen. Wilcoxon signed-ranks test was used to determine significance between each patient and its individually matched control (** represents significant difference; p<0.01).

