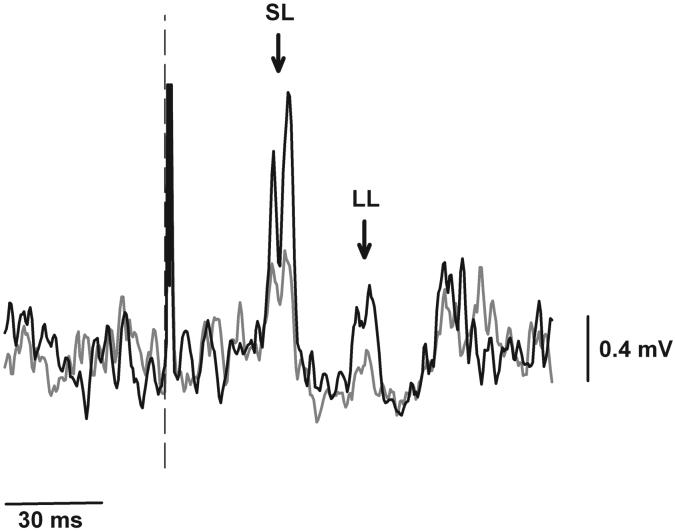
Fig 3.
EMG response of the first dorsal interosseus muscle to electrical stimulation of the median nerve is shown for a representative subject (same subject as illustrated in Fig 2, panel C). Traces represent an average of 24 EMG responses for the force (grey lines) and position (black lines) tasks. Dashed line indicates stimulus onset. Short-latency (SL) and long-latency (LL) reflex responses are indicated by arrows. SL and LL responses were greater for the position task compared with the force task.

