
Figure 2.
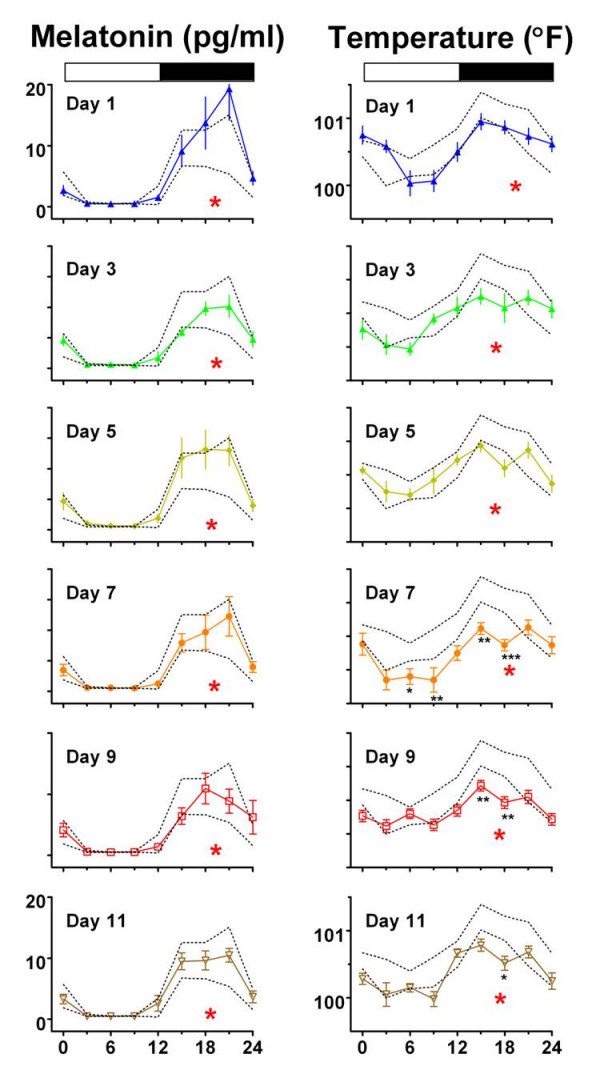
Time course of reentrainment of MT (left) and BT (right) rhythms to a 6-h phase advance of LD12:12. The Figure 1 curves for Days 1 through Day 11 are re-plotted in a vertical array to show mean+/-SEM in relation to the Day 0 curve, which has been advanced 6 h for comparison. Dotted lines connect the upper and lower 95% confidence limits of the phase shifted Day 0 means. Without exception, Day 1 through Day 11 melatonin curves closely paralleled the zeitgeber time adjusted (6 h advanced) baseline Day 0 curve. By contrast, BT curves on Days 7, 9 and 11, deviate significantly from baseline at individual ZT times marked by adjacent black asterisks (* p < .05; ** p < .01; *** p < .001). Large red asterisks beneath each curve represent cosine fitted acrophases (ZT), which for BT, are notably phase delayed in association with the waveform distortions on Days 7–11 (see Figure 3A). Other conventions as in Figure 1.