
Figure 2.
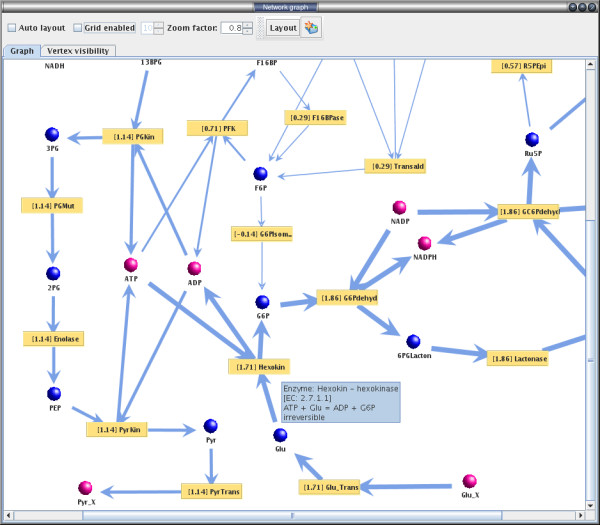
Metabolic network visualization using YANAsquare. Visualization of a metabolic network as a bipartite graph using YANAsquare. Metabolites are drawn as bullets where blue indicates internal (or balanced) metabolites and purple bullets depict metabolites outside system boundaries (external metabolites). Enzymes are drawn as yellow squares including the flux through the enzyme given the current set of elementary mode activities. Tooltip texts give detailed information about both enzymes and metabolites such as net reaction, reversibility and enzyme description. The widths of the arrows give a quick indication of the relative amount of flux through the reaction compared to the overall flux distribution.