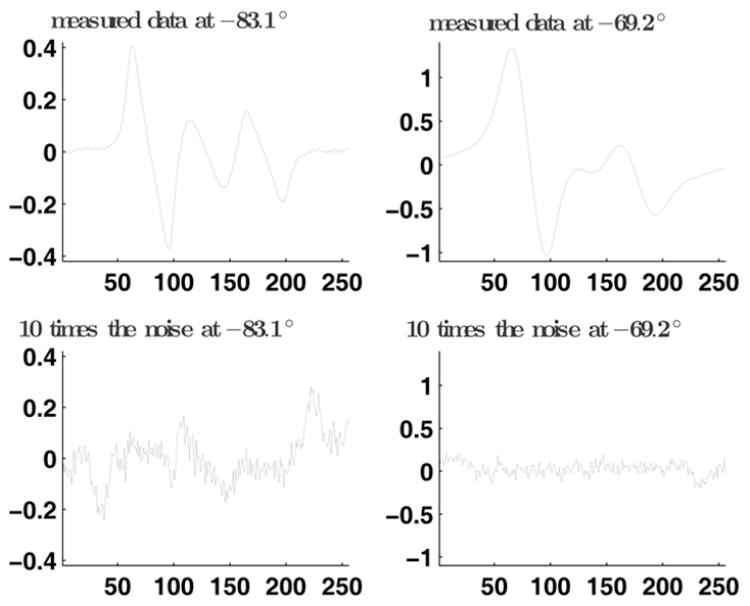
Fig. 11.

Measured data and residual fit error. Top-left: The measured data at −83.1 °. Top-right: Measured data at −69.2 °. Bottom-left: 10 times the residual fit error at −83.1 °. Bottom-right: 10 times the residual fit error at −69.2 °. The vertical axis is in arbitraty unit and the horizontal axis denotes sample number.
