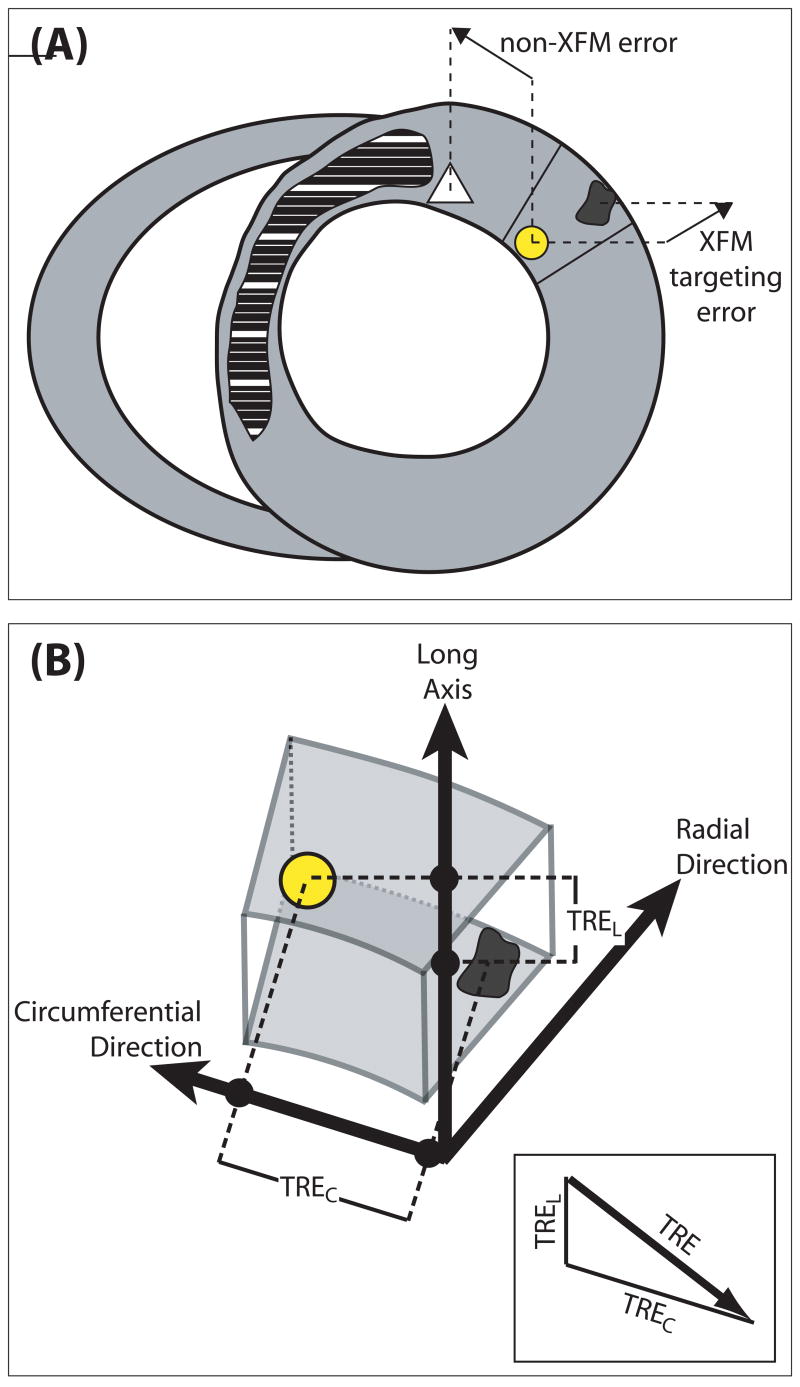
Figure 4.
A, Schematic short-axis slice, with normal myocardium in gray and the infarct in cross-hatch. The yellow spot represents an XFM-predicted injection location. The dark spot represents the susceptibility artifact on T2*W-GRE imaging due to injected Fe-MSC. The white triangle denotes an ideal target. The distance between the white triangle and the yellow dot represents errors due to device and operator factors, whereas the distance between the yellow dot and dark spot represents intrinsic targeting errors of our registration method. B, Calculation of the target registration error (TRE). A 3D vector relates the end-diastolic XFM-derived injection location (yellow) and the centroid of the corresponding iron injection (black) on the postinjection end-diastolic T2*W-GRE MRI images. The target registration error is the length of the circumferential (TREC) and long-axis (TREL) components of this vector. The radial component of the vector, which is not controlled by the operator, is ignored (see text).

