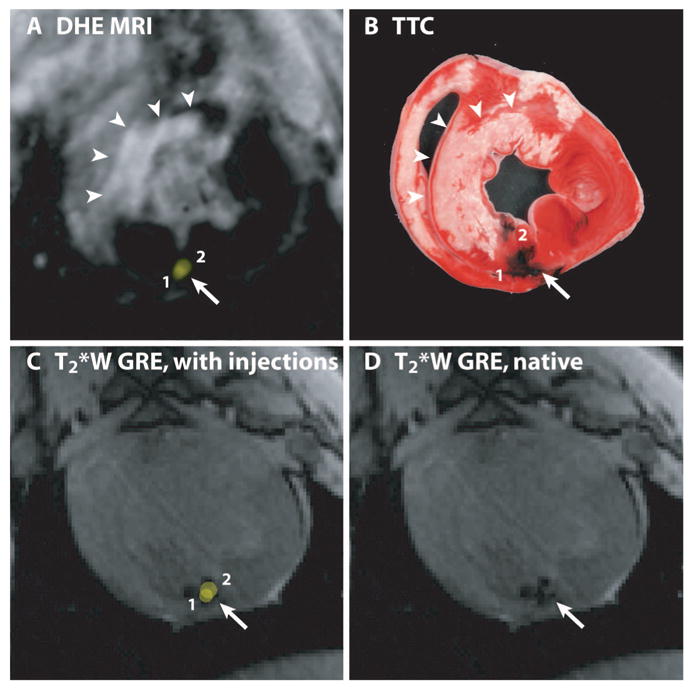
Figure 5.

The locations of 2 XFM-guided injections of Fe-MSC mixed with tissue dye are shown relative to areas of infarction demonstrated in vivo by DHE MRI (A) and ex vivo by TTC staining (B). The XFM-guided injection locations (yellow spots, numbered 1 and 2) are superimposed on the preinjection DHE-MR to target injections (A) and on the postinjection T2*W GRE image (C) to validate in vivo accuracy of XFM-guided injection locations. The susceptibility artifact on this image resulting from injected Fe-MSC is better appreciated in D. The distributions of tissue dye stains on the TTC-stained heart slice (B) and susceptibility artifacts (D) are very similar.
