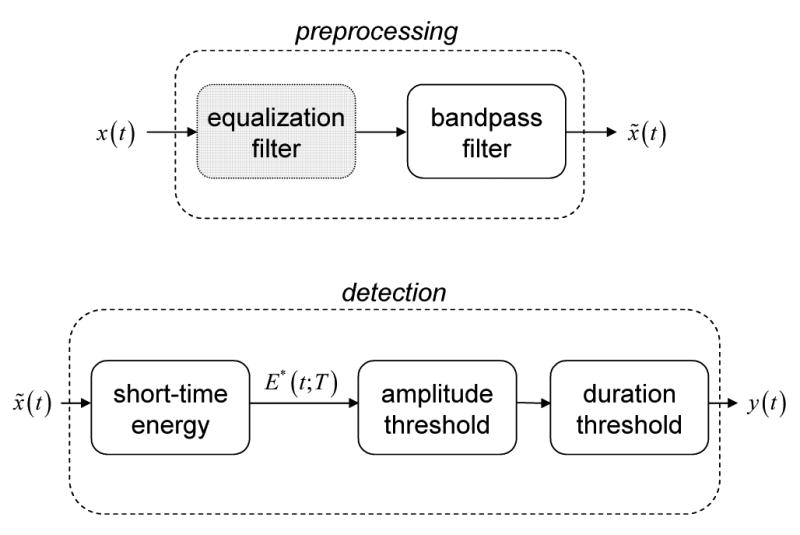
Figure 2.

Block diagram of basic EEG processing for bandpass energy-based HFO detection. The EEG signal, x(t), is analyzed first by preprocessing, then by detection, to produce an indicator, y(t), of HFO events. The short-time energy, E* (t;T), may be replaced by similar measures, e.g., line length. (Gray) Equalization may be applied during preprocessing to compensate for EEG spectral rolloff.
