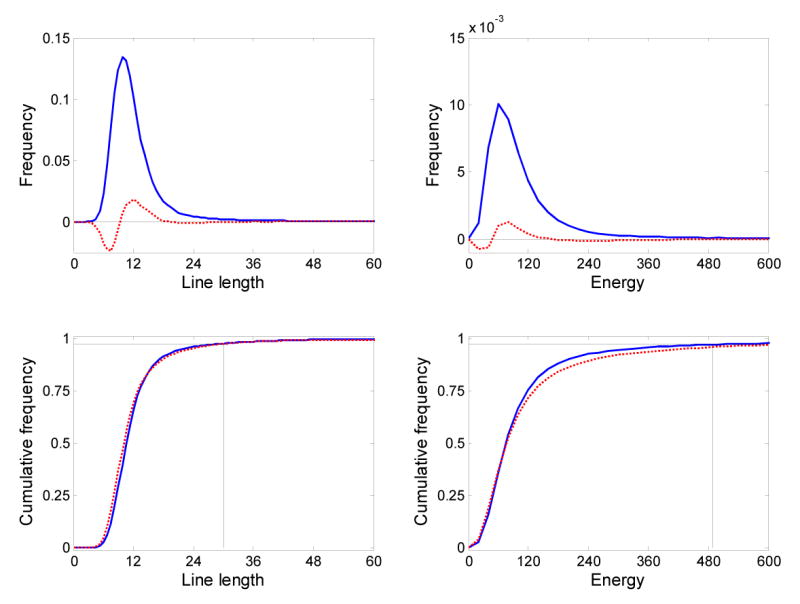
Figure 3.

(Top row) Distribution of line length and energy values for patient 1 (solid blue lines), and difference between distributions for patients 1 and 2 (dashed red lines). (Bottom row) The cumulative distributions of line length and energy values for patient 1 (solid blue lines) and patient 2 (dashed red lines) used to select a threshold for the automated detection algorithm. Thresholds are shown for patient 1 for the 0.975 quantile.
