
Figure 4.
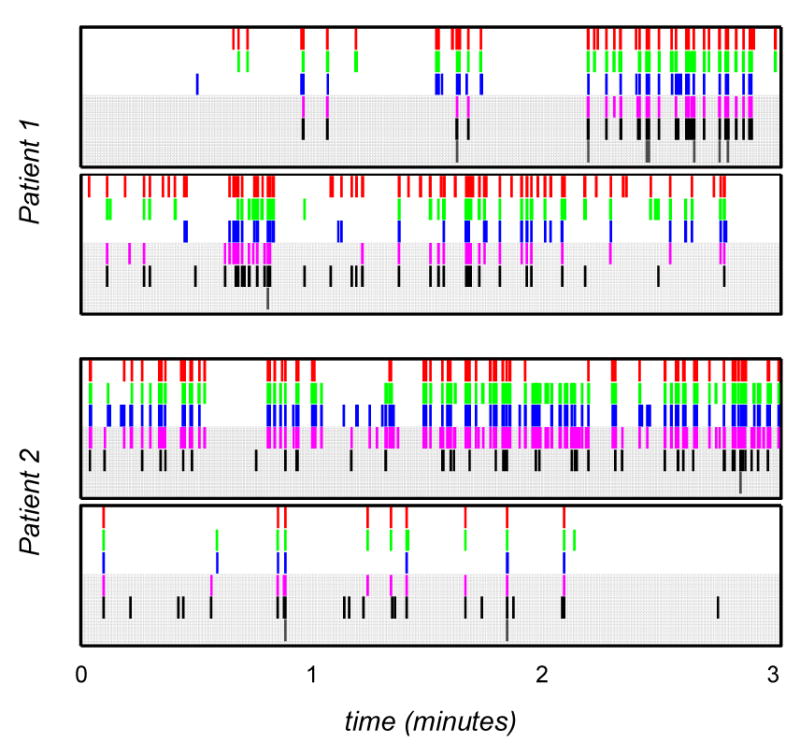
Representative HFO identifications for both patients for each detector. (Top-to-bottom in each plot) Detection sequences correspond to A (red), B (green), C (blue), X (magenta), Y1 (black), Y2 (charcoal). Gray background highlights detections by automated detectors.