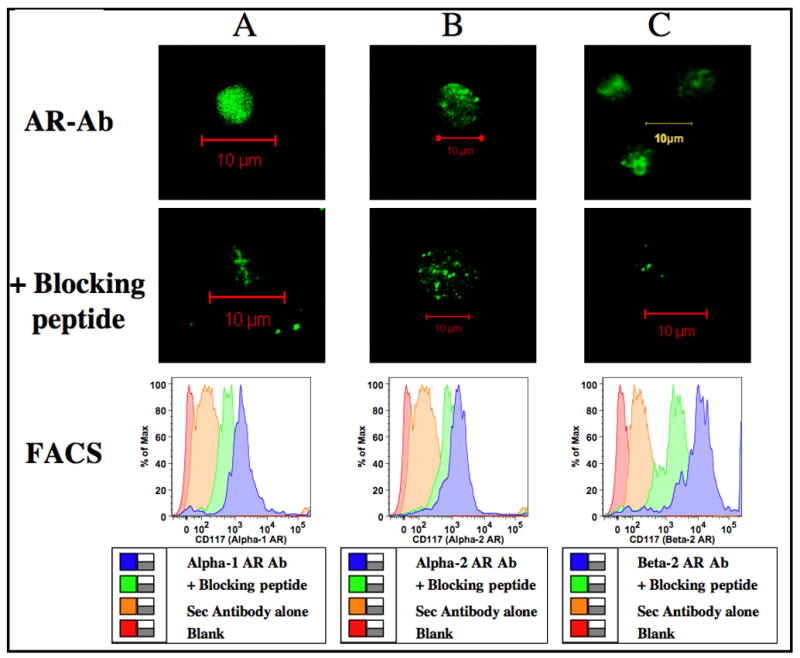
Figure 4.

Adrenergic receptor distribution in CD117+ progenitors. Murine bone marrow cells were enriched for CD117+ using Ab coupled micro-bead technology and labeled with primary antibody specific for adrenergic receptor subtypes with and without specific blocking peptides followed by FITC conjugated secondary antibody. Confocal images were obtained in a Zeiss LSM 510 confocal microscope. Green color represents binding of the polyclonal Abs to the C-terminus of adrenergic receptor subtypes in CD117+ cells. Image resolution=1024 × 1024; Scale bar=10μm. Histograms were generated by FACS. Logarithmic scale of mean fluorescent intensity of specific adrenergic receptor subtype is represented on the X-axis and the percentage of cells expressing α1-, α2- or β2- adrenergic receptors is represented on the Y-axis. Panels A, B and C represents α1-, α2- and β2- adrenergic receptors respectively.
