
Fig. 2. Biofilms exhibit increased tolerance to H2O2 and lactic acid.
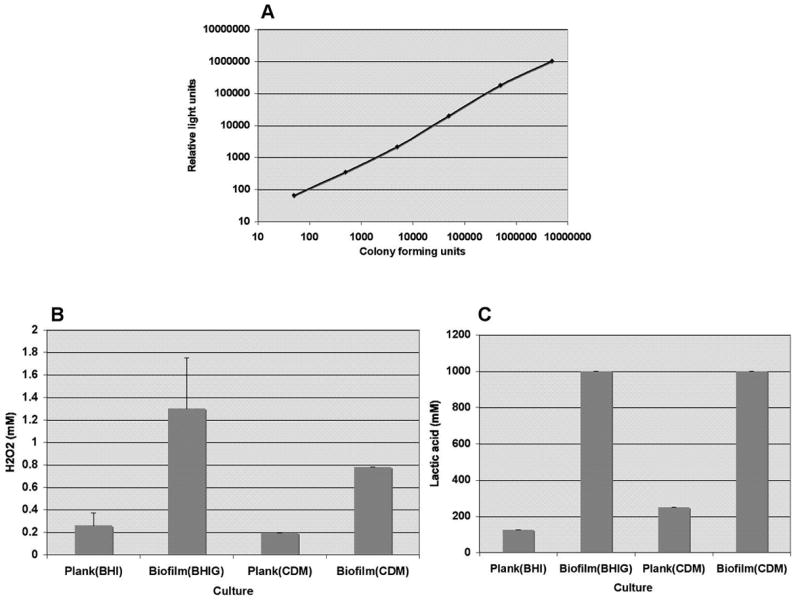
Panel A illustrates the direct correlation between the number of colony forming units (x-axis) and relative light units (y-axis) measured in the viability assay. In Panel B, the MBC90 of H2O2, or the concentration required to decrease viability of biofilm and planktonic cultures grown in BHI or CDM by at least 90% is shown. In Panel C, the concentration of lactic acid required to decrease viability of biofilm and planktonic cultures grown in BHI or CDM by at least 90% is shown. Bars in Panels B and C represent the averages of three separate experiments and error bars represent the standard deviations.