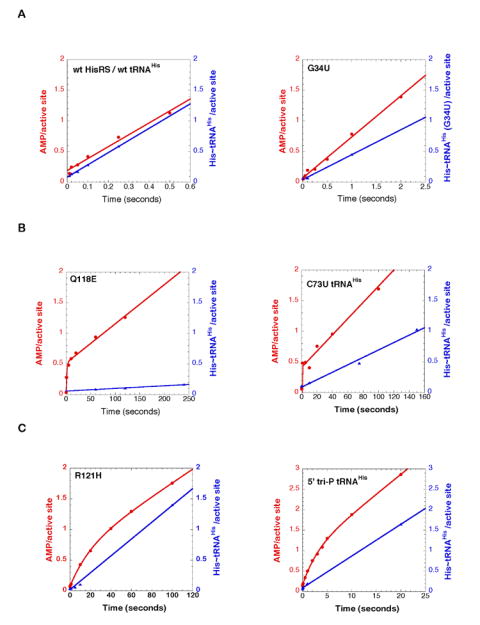
Figure 3.

Representative multiple turnover progress curves for wild type HisRS and mutant tRNAHis comparing the production of [α-32P]-AMP (filled red circles) and [14C]-His~tRNAHis (filled blue triangles) at pH 7.5 and 37°C.
(A) Representative enzyme-tRNA combinations in which ktrans was greater than kcat, and progress curves for the two products were linear. The plots for wt tRNAHis/wt HisRS, and G34U tRNAHis/wt HisRS are depicted here. The remaining plots for other mutants are presented in Supplementary Figure 2.
(B) Representative enzyme-tRNA combinations in which there was a burst of AMP formation in the first turnover. The plots for wt tRNAHis/Q118E HisRS, and C73U tRNAHis/wt HisRS are depicted here. The remaining plots for other mutants are presented in Supplementary Figure 2.
(C) Enzyme-tRNA combinations where slow burst kinetics was observed, owing to effects on both adenylation and aminoacyl transfer. The wt tRNAHis/ R121H HisRS and 5’-ppp tRNAHis/wt HisRS were the only combinations that exhibited this behavior.
