
Fig. 6.
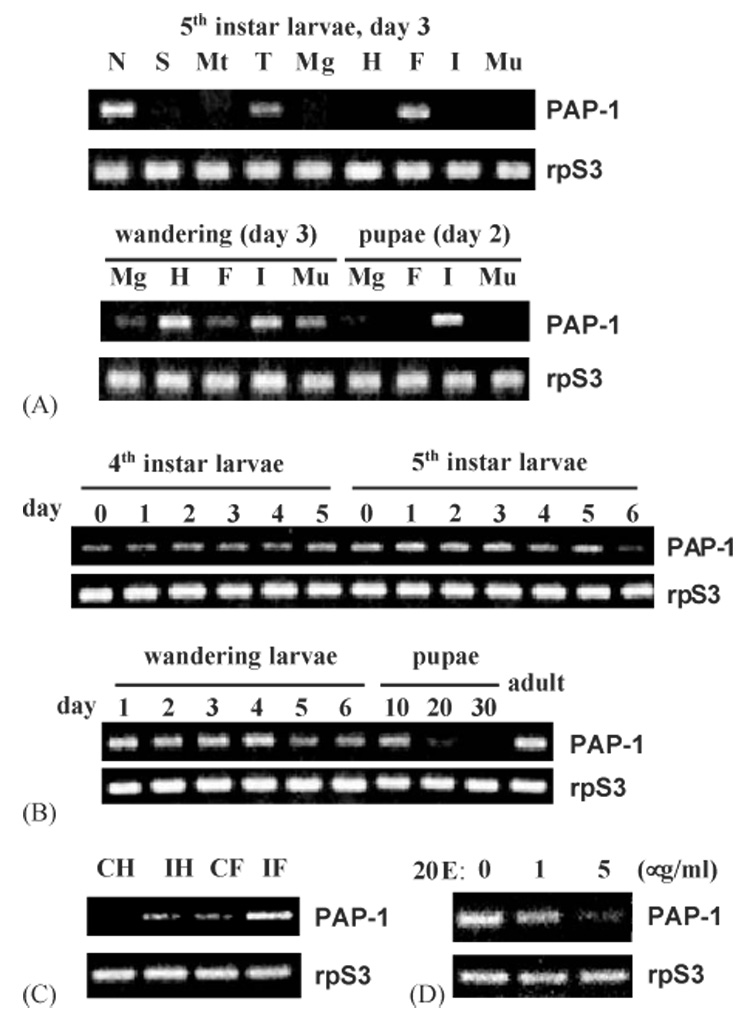
RT–PCR analysis of M. sexta PAP-1 mRNA levels. Panel A: PAP expression in nerve tissues (N), salivary glands (S), Malpighian tubules (Mt), trachea (T), midgut (Mg), hemocytes (H), fat body (F), integument (I), and muscle (Mu) of the 5th instar larvae (day 3), wandering larvae (day 3) or early pupae (day 2). Panel B: changes of PAP-1 mRNA level in fat body from M. sexta at different developmental stages. Panel C: induced transcription of PAP-1 gene in hemocytes and fat body upon bacterial infection. CH and CF: hemocytes and fat body from the naïve larvae; IH and IF: hemocytes and fat body collected from the larvae at 24 h after injection of E. coli ; Panel D: transcriptional suppression of PAP-1 gene in the cultured fat body by 20-hydroxyl ecdysone at different concentrations. M. sexta ribosomal protein S3 (rpS3) transcripts were normalized in all these analyses.