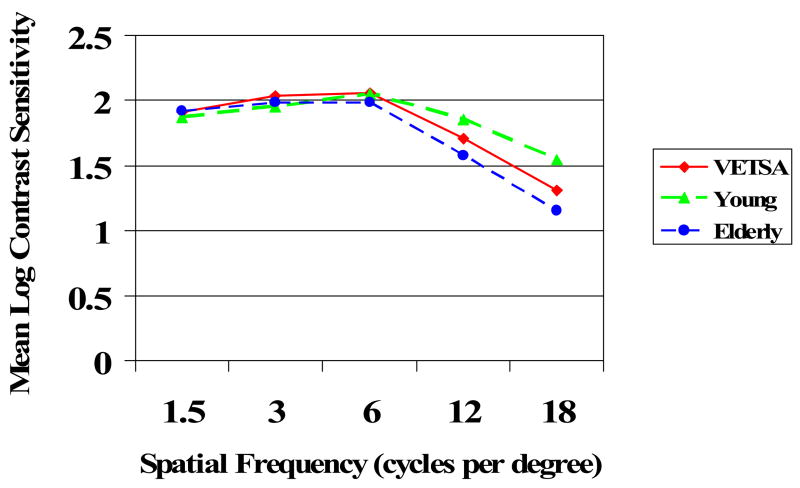
Figure 2.
Mean performance of young comparison adults (n = 14, ages 18 to 25), the VETSA sample (n = 714, ages 52 to 60), and elderly comparison adults (n = 16, ages 61 to 82) at each spatial frequency as a function of the mean log contrast sensitivity. Standard deviations at 1.5, 3, 6, 12, and 18 cpd respectively are as follows for each group: Young .12, .28, .27, .20, .27; VETSA .11, .14, .16, .24, .29; Elderly .08, .16, .14, .25, .23.

