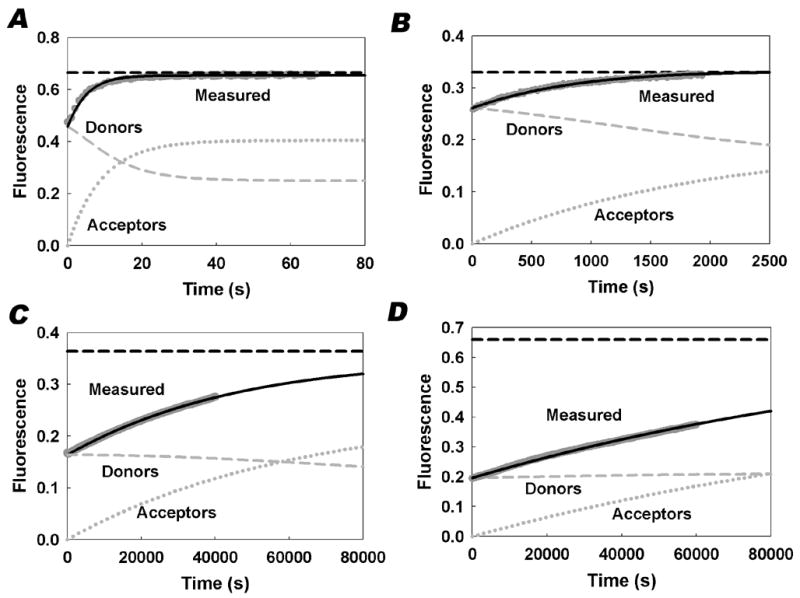
Figure 3. Representative intervesicular transfer traces.

Transfer of each fluorescent PC analogue from donor vesicles to acceptor vesicles was monitored as an increase in fluorescence as described in “Materials and Methods.” Graphs are representative traces of NBD-PC (A), Bodipy FL-PC (B), Bodipy 530-PC (C), and Bodipy 581-PC (D). Experimental data are shown in dark gray. Equations 5–7 were used to generate the plots for the predicted total fluorescence (solid black line), the predicted fluorescence of the donor vesicles (gray dashed), and the predicted fluorescence of the acceptor vesicles (gray dotted). The black horizontal dashed line represents the predicted maximum fluorescence after equilibration.
