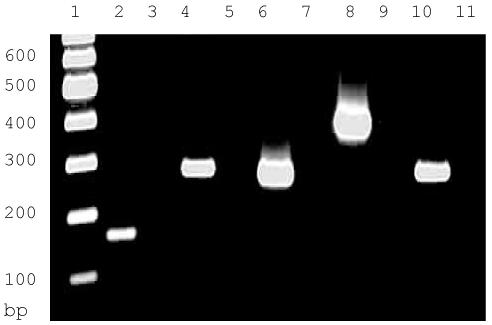
Figure 4.

Relative levels of tTlls and tTllc in the cerebellum of the turtle as determined by RT-PCR. Lane 1, DNA ladder; Lane 2, tTlls 163 bp reaction; Lane 3, control tTlls 163 bp reaction; Lane 4, tTlls 326 bp reaction; Lane 5, control tTlls 326 bp reaction; Lane 6, tTllc 273 bp reaction; Lane 7, control tTllc 273 bp reaction; Lane 8, tTllc 416 bp reaction; Lane 9, control tTllc 416 bp reaction; Lane 10, turtle actin (296 bp); Lane 11, control turtle actin.
