
Figure 6.
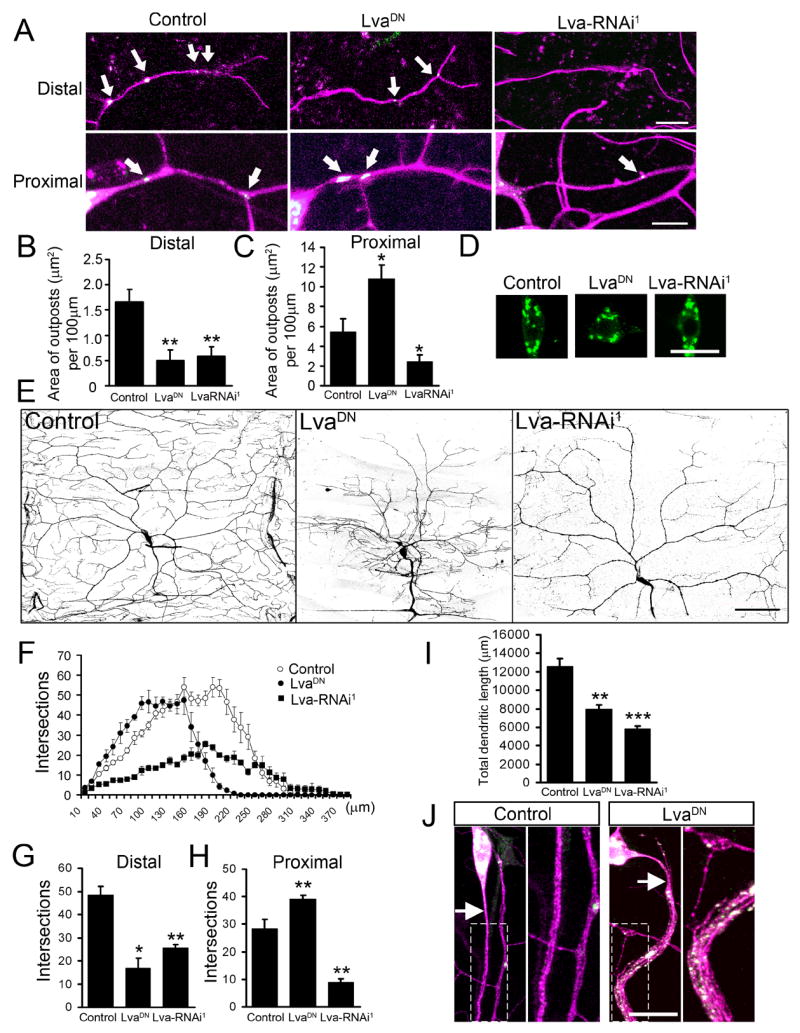
Redistribution of Golgi outposts by LvaDN and Lva-RNAi correlates with morphological changes of dendritic arbors. Magenta: mCD8-dsRed. Green: GalT-EYFP. (A) Representative pictures of Golgi outposts in distal and proximal dendrites in control, LvaDN-, and Lva-RNAi1-expressing ddaC neurons. Expression of LvaDN was driven by Gal44-77. Expression of Lva-RNAi was driven by Gal4109-2-80 to achieve earlier and stronger knockdown effect. Arrows point to Golgi outposts. Scale bars: 10 μm. (B–C) Quantification of the total size of Golgi outposts in distal dendrites (100 μm in length from the tip of the dorsal-most branch toward the soma) and proximal dendrites (30 μm from the soma). (D) Golgi structure in the soma. Scale bar: 15 μm. (E) Dendrite morphology of control, LvaDN-, and Lva-RNAi1-expressing ddaC neurons. Dendrites of Lva-RNAi1-expressing neurons were labeled by ppk-EGFP. Scale bar: 75 μm. (F) Sholl analysis histogram. (G) Number of intersections between distal dendritic branches and circles with 180 μm radius. (H) Number of intersections between proximal dendritic branches and circles with 80 μm radius. (I) Quantitation of total dendritic length. (J) Golgi outposts and exuberant branches appear in the proximal axons of LvaDN-expressing neurons. Magnified view of the boxed areas is shown in the right panels. The arrows point to the axons. Scale bar: 15 μm.