
Figure 1.
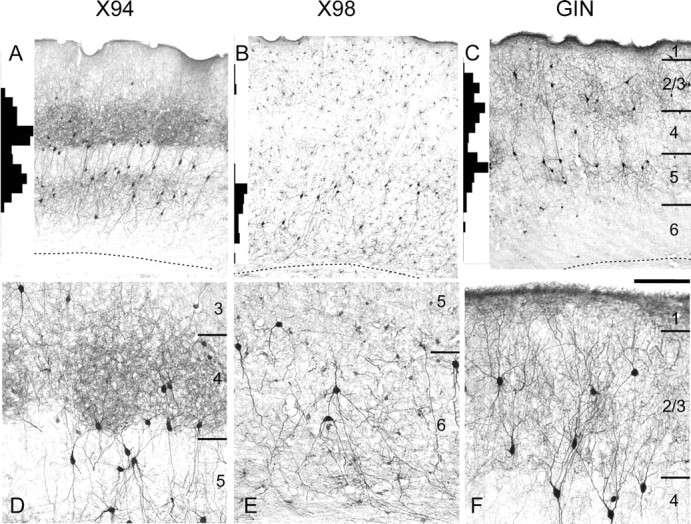
Laminar distribution patterns of GFP+ interneurons. GFP expression was visualized by anti-GFP immunocytochemistry in 40-μm-thick coronal sections from brains of 2- to 3-month-old animals. A–C, Low-power images. D–F, High-power images from different sections of the same brains. Histograms at the left margin of A–C show the laminar distribution of GFP+ neurons, counted in 50 μm bins in vertical strips through the barrel cortex. Bin heights in the three panels are to the same scale; the highest bin in A represents 30 counts. Note the nearly complementary distribution patterns of the three lines. The laminar boundaries indicated in C apply also to A and B; the dotted lines indicate the white matter border. D–F are not aligned by layers. Scale bar: A–C, 250 μm; D–F, 100 μm.