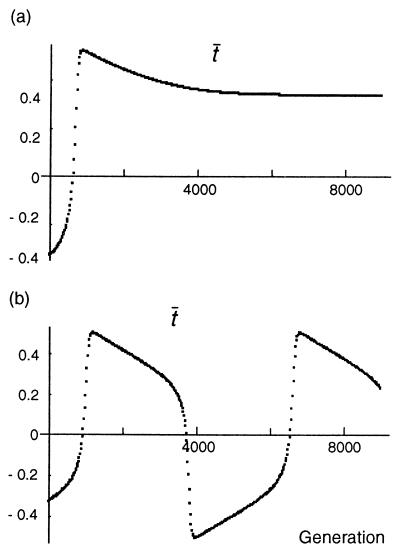
Figure 1.
Evolution of the mean male ornament size (t̄) through time (mean female preference p̄ follows a similar path). The population is plotted every 40 generations. Two conditions varying in the degree of mutation bias are shown leading to a stable equilibrium (u = 0.0001) (a) and cyclic evolution (u = 0) (b). Other parameter values are a = 0.4, b = 0.001, c = 0.05, Gt = 0.5, and Gp = 0.5.

