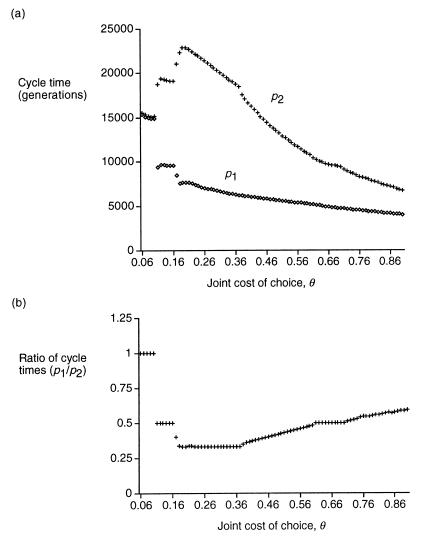
Figure 3.
Length of an evolutionary cycle plotted against epistasis in the joint cost of choice (θ) when the individual cost of choice is higher for p1 than for p2 (λ1 = 1, λ2 = 0.6). Plots are given for the number of generations per cycle (p1 diamonds, p2 crosses) (a) and the ratio of p1 cycle time to p2 cycle time (b). Other parameter values as in Fig. 2.

